Results Tab
After you publish the survey, the Results tab will be unlocked. Through this tab you can view the results of each instance of the survey. If there are no responses yet, the page will be empty; otherwise, it will contain the following:
- Instance dropdown menu: through this menu, select the instance you want to view the results for.
- Refresh button: this button enables you to refresh the result page.
- Statistics: through this section, you can view the statistics of the survey, including the total invitations and total responses, in addition to a chart that shows complete answers, incomplete answers, and not started.
- Score Overview: this section calculates the average score for all questions and for all completed answers.
- Results: you can view the survey results based on the questions or the respondents, as detailed below:
- Per Respondent: in this option, the system shall display the list of the respondents, where for each one the Respondent, Start Date, Time Taken, and Answers are displayed. In public surveys, respondents will be anonymous, while in private surveys, respondents’ emails will be shown. You can view the answers of each respondent by clicking the See Answer link next to it, when clicked, the system shall display a side panel that contains each question and its answer.
- Per Question: this is the default view, for each question, the system shows the number of respondents who answered it, and who skipped it. You can export the questions results to Excel sheet by clicking the (Export Excel File) button. Note that the results of each question and its calculation differ based on the question type.
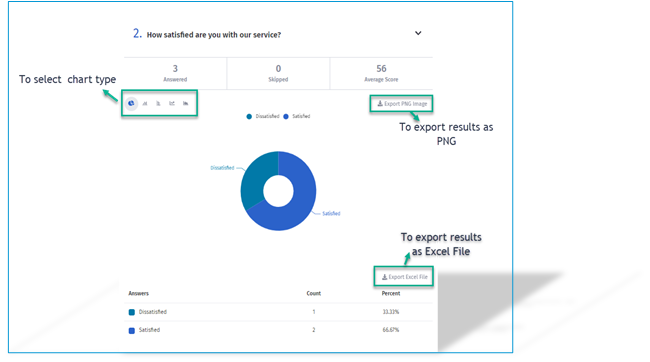
If the question answer includes charts, then the results will be as in the image below, and you can export the answer as PNG image by clicking the (Export PNG Image) button or export it as Excel file by clicking the (Export Excel File) button. Note that the default chart type is the Pie chart, and you can change it by clicking the desired type’s icon.
Score Calculations
Respondent Score Per Question Calculations
| ID | Question Type | Score Calculating Results |
| 1 | Radio, Dropdown, Rating, Satisfaction Questions | Score = Answer Score / Max Score * 100% |
| 2 | Checkbox Questions | Score for Checkbox questions = ((SUM of Answered Scores / Max Score)/ # of Choices) * 100% |
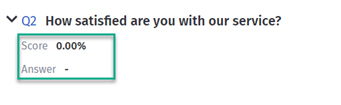
- For non-scoring questions the score appears as dash (-).

- For skipped and not completed scoring questions the score appears as zero.
Respondent Score Calculations
The score per individual respondent is calculated as the average of all scoreable questions.
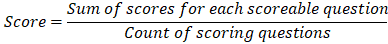
Note: For skipped and not completed questions, they are included in the count of scoring questions.
Respondent Score by Group Calculations
The group score per respondent is calculated based on the group questions defined when building the survey as below:
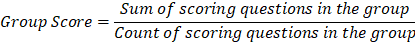
For Example: Group A is assigned to questions number 1 & 2 (Q1 & Q2) in the survey image below:
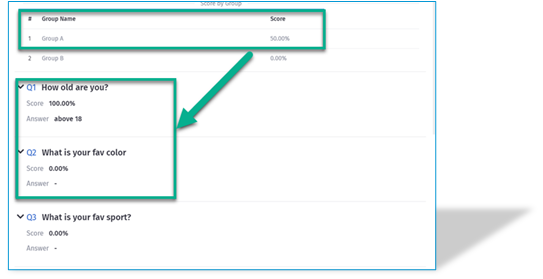
The group score is calculated as = (100%+0%)/2 = 50%
Score Overview Calculations
- The overall survey group score is calculated as the average score per group for all respondents.
- The overall survey average score is calculated as the average score for all respondents.
- The overall survey average score (complete answers) is calculated as the average score for all completed respondents.